
Content marketing reporting tools allow you to track, analyze, and present data and qualitative feedback to your boss or client. Their main purpose is to look back on performance and help make data-driven decisions.
This article lists a complete tool stack that will allow you to track all the
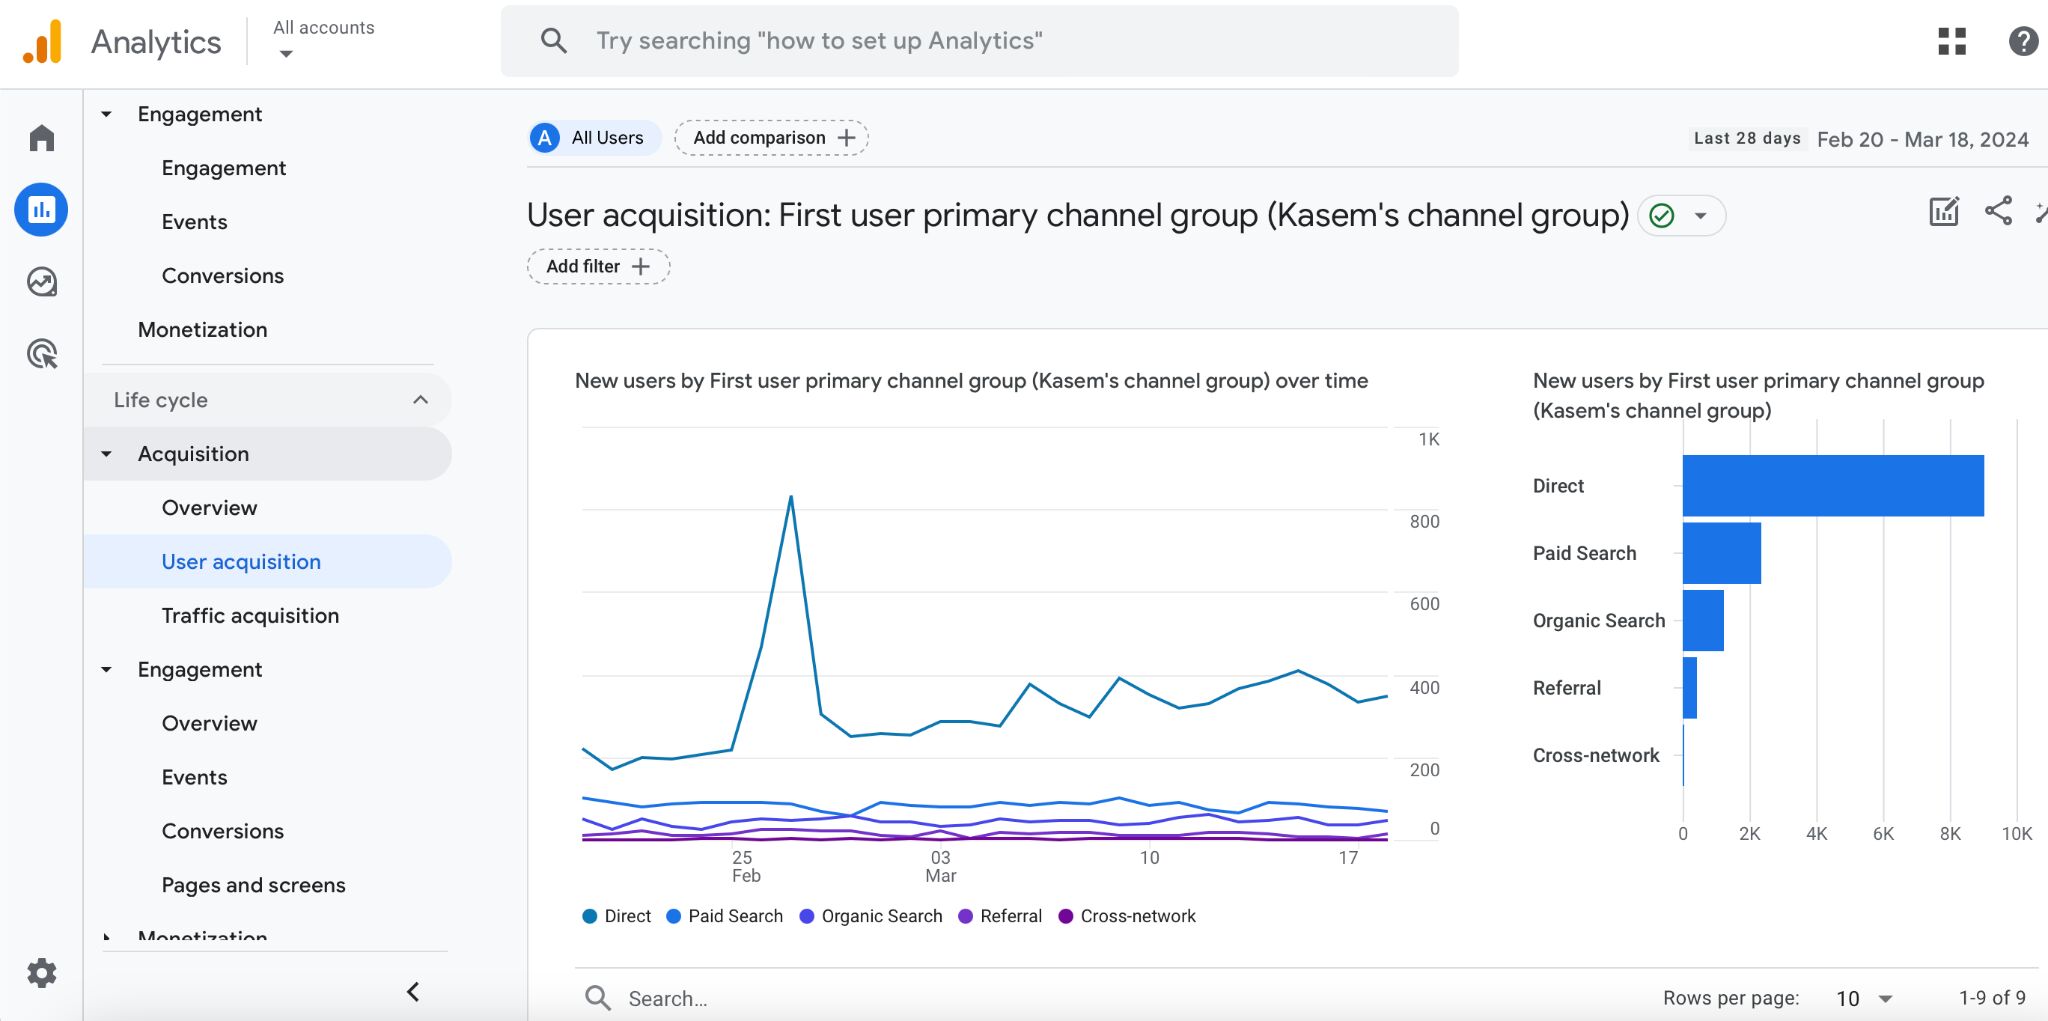
You will need the built-in analytics from social media platforms to report:
- Content output.
- Likes.
- Comments.
- Reach.
- Audience growth.
Using your social media platforms’ analytics instead of social media management tools is a cost-effective option. After all, social media aggregators like Buffer or Sprout Social show mostly the same data you can get in native analytics.
So if you’re tracking just a few metrics for one to three sites, this is all you need. You can simply report that data directly in your document or feed it to Looker through a Google Sheet.
However, this setup may not be optimal for everyone. For those managing multiple social media accounts, handling numerous clients, or seeking more efficient reporting methods, there are alternatives worth considering:
- Using data connectors for Looker Studio.
- Using reporting tools like Dashthis or Whatagraph with built-in social media integrations.
- If you’re not interested in building dashboards, tools like Buffer or Sprout Social should be enough to create reports for all your data. Plus, some of them will also give you data on competitors.
Google Looker Studio is a powerful free tool for converting data into interactive, shareable dashboards. With it, your stakeholders can get instant, always-on access to all the important metrics without the need to learn any tools, pay for access or bother you with the smallest requests like showing the same data for a different date range.
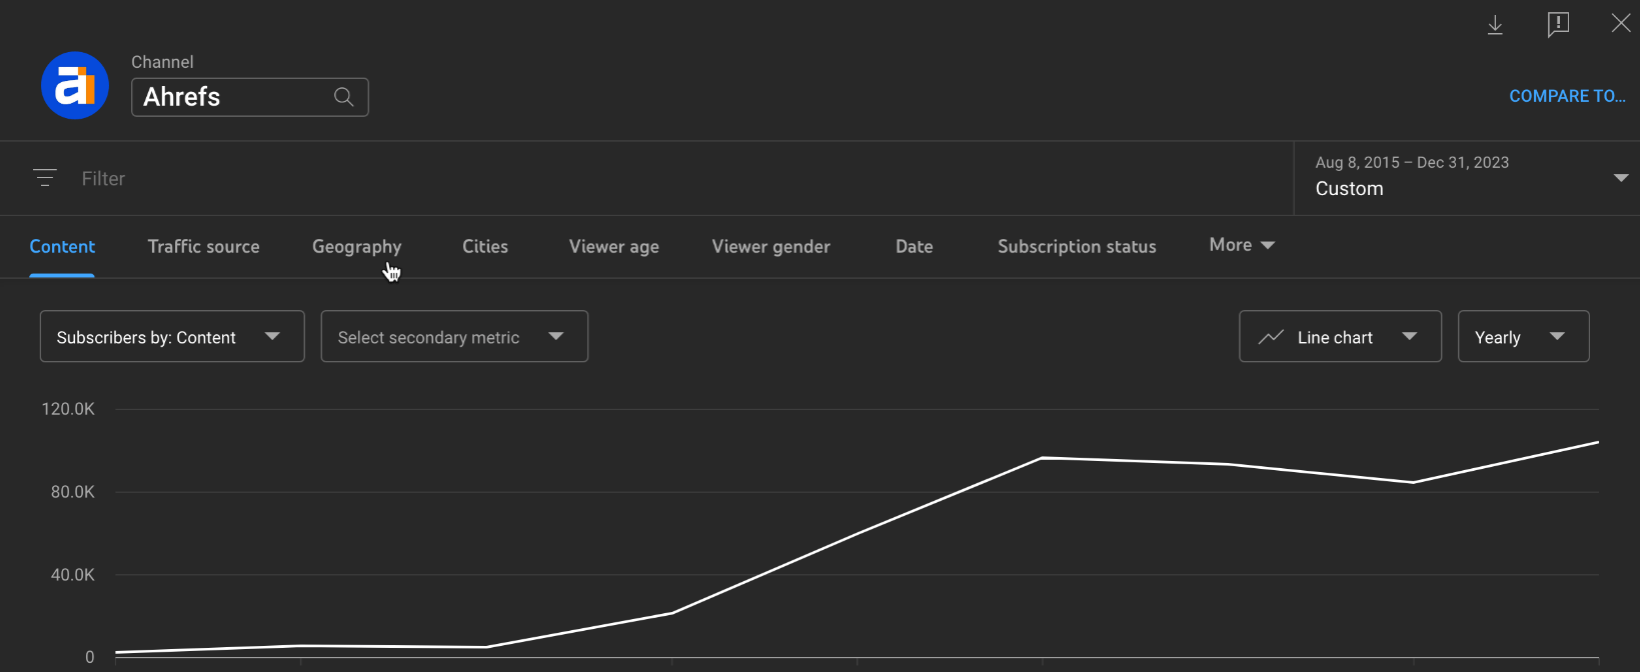
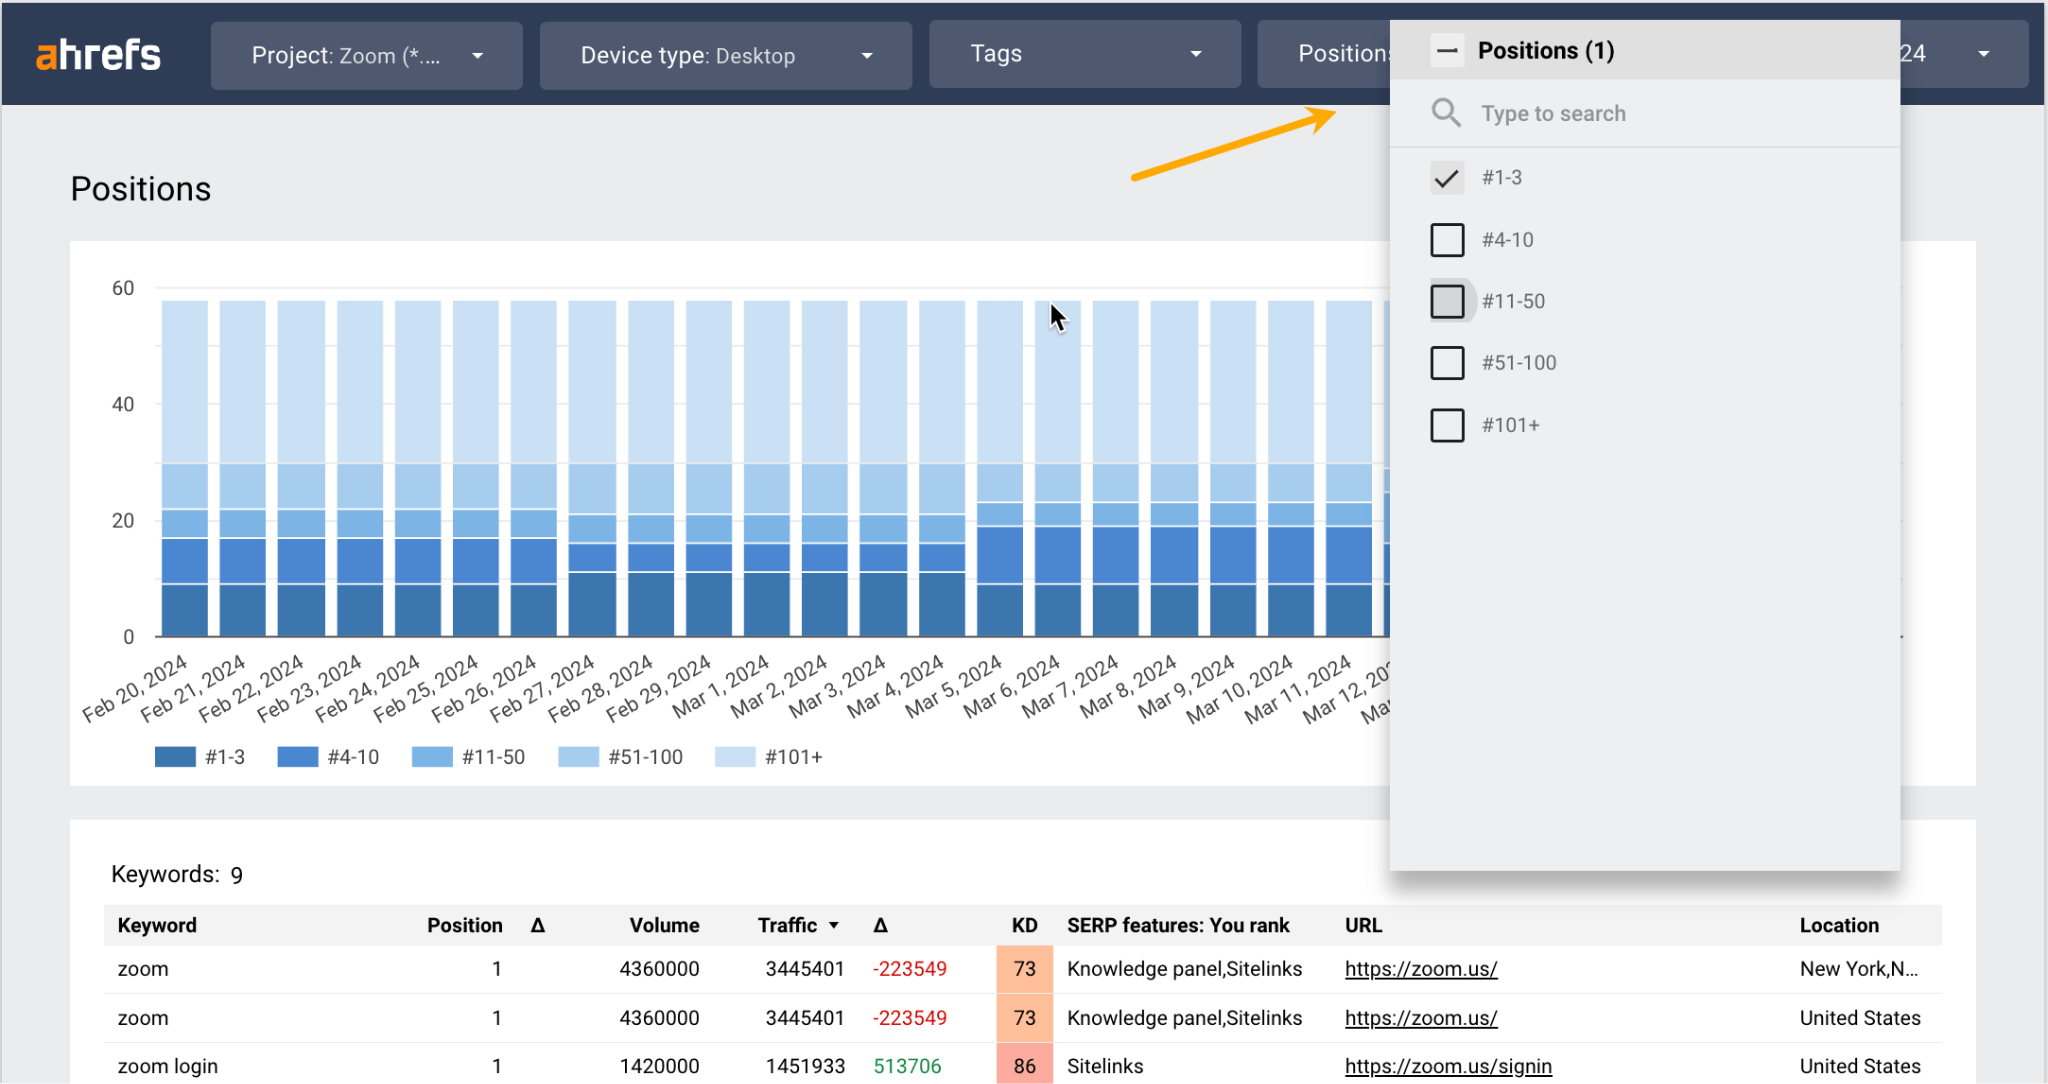
If you never use Looker or a similar tool, you can see a live dashboard example with data from Ahrefs to get a feel of it. Notice that the top navigation bar allows the user to filter the report.
There are three different ways to use the tool, and they depend on how much you can invest in automated reporting.
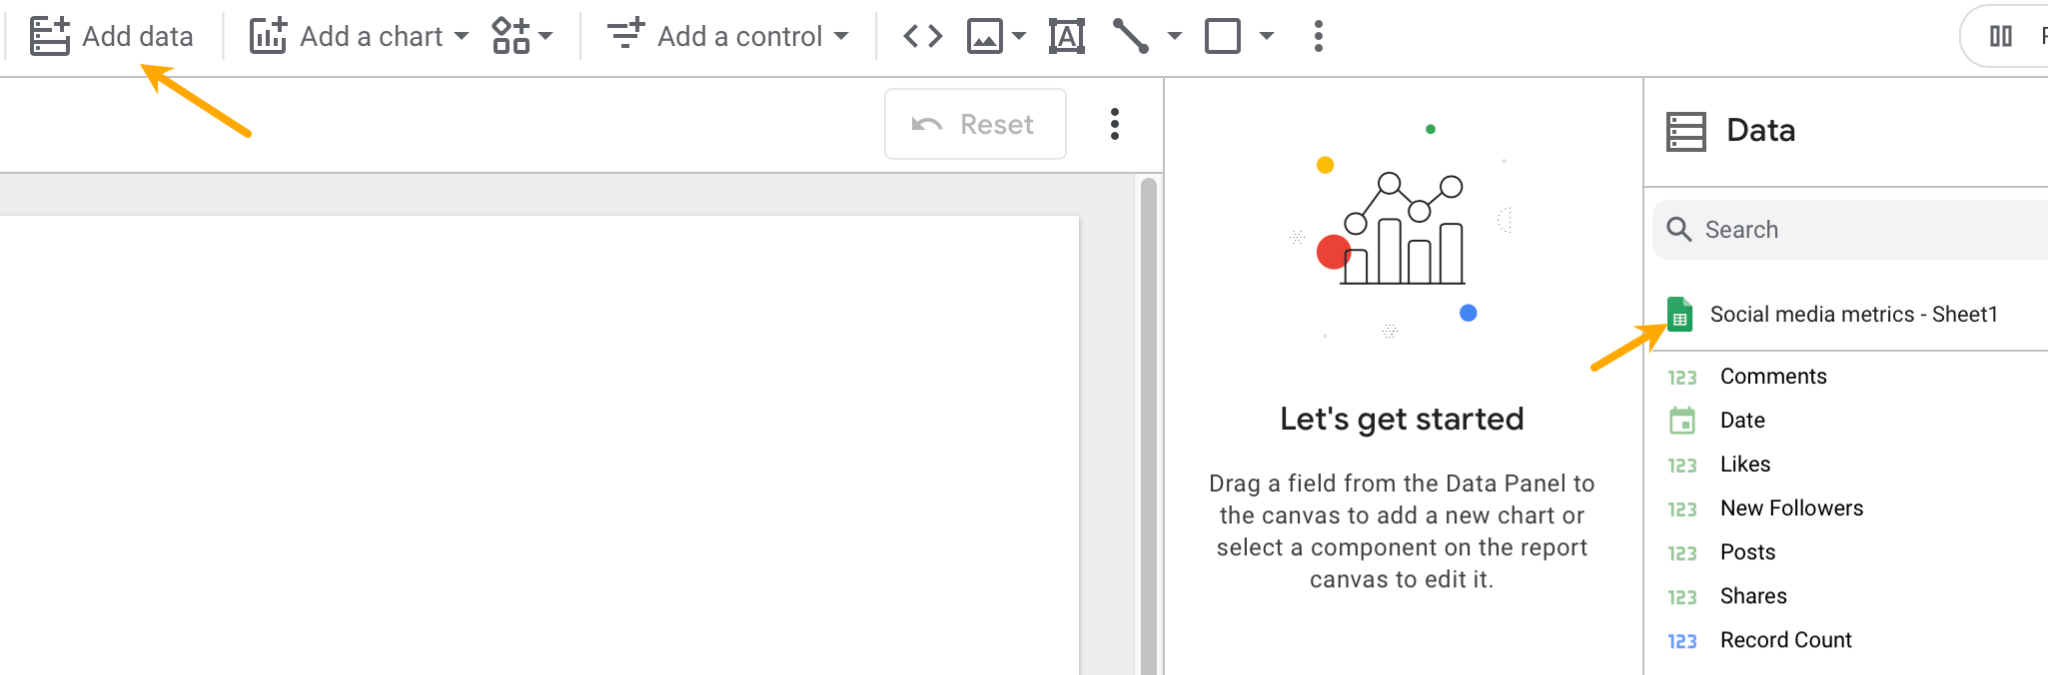
- Enter data through Google Sheets (costs only your time). This can be a viable option if you’ve got a small number of metrics to report on and you’re reporting on up to three different sites. It works by manually entering the data into Google Sheets from your tools or semi-manually, by exporting data from the tools and importing it into Google Sheets.
- Use a dedicated data connector (like the one in Ahrefs). If you want to save time through automated reporting or you’re working with many sites/clients, tools with Looker data connectors are something to consider.
- Use a business analytics tool (like Supermetrics). A solution that offers connectors for various tools in one place. It acts as an intermediary between your analytics tools and Looker. It may be worth the cost if there are too many tools in your stack that need separate paid connectors.
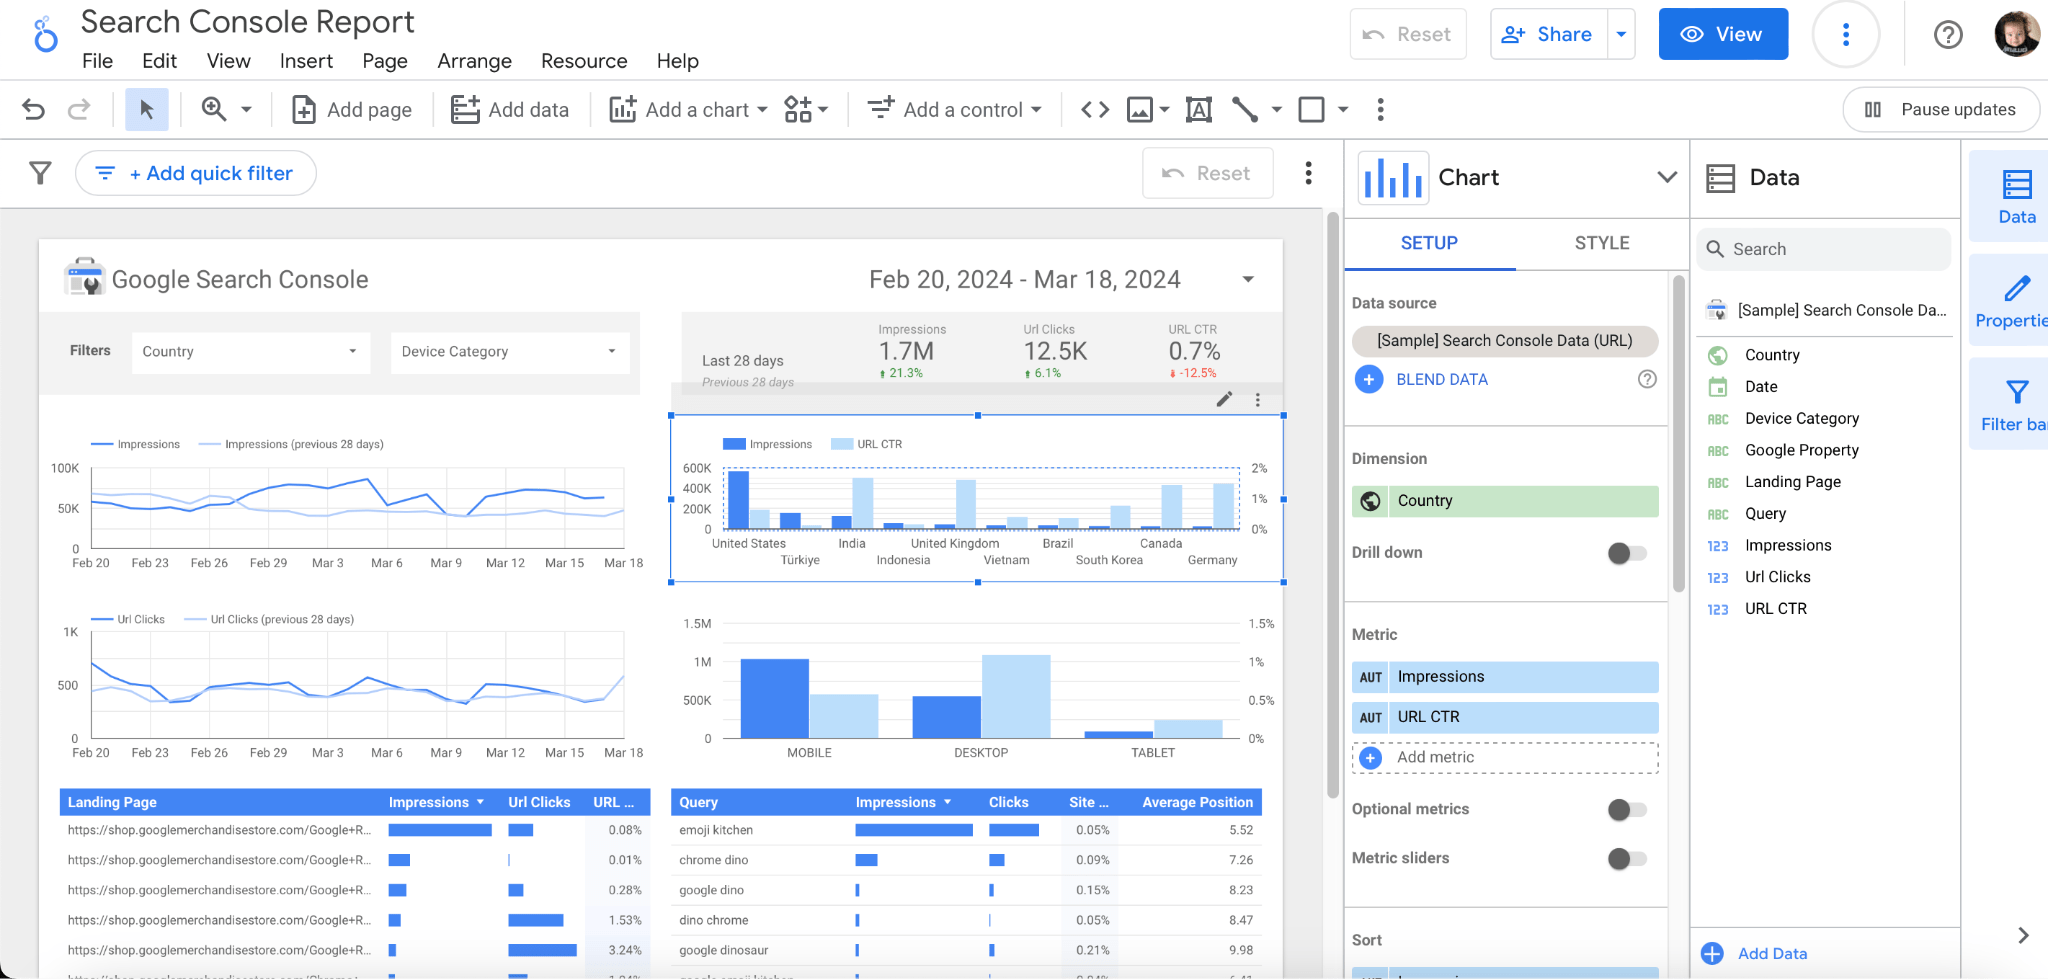
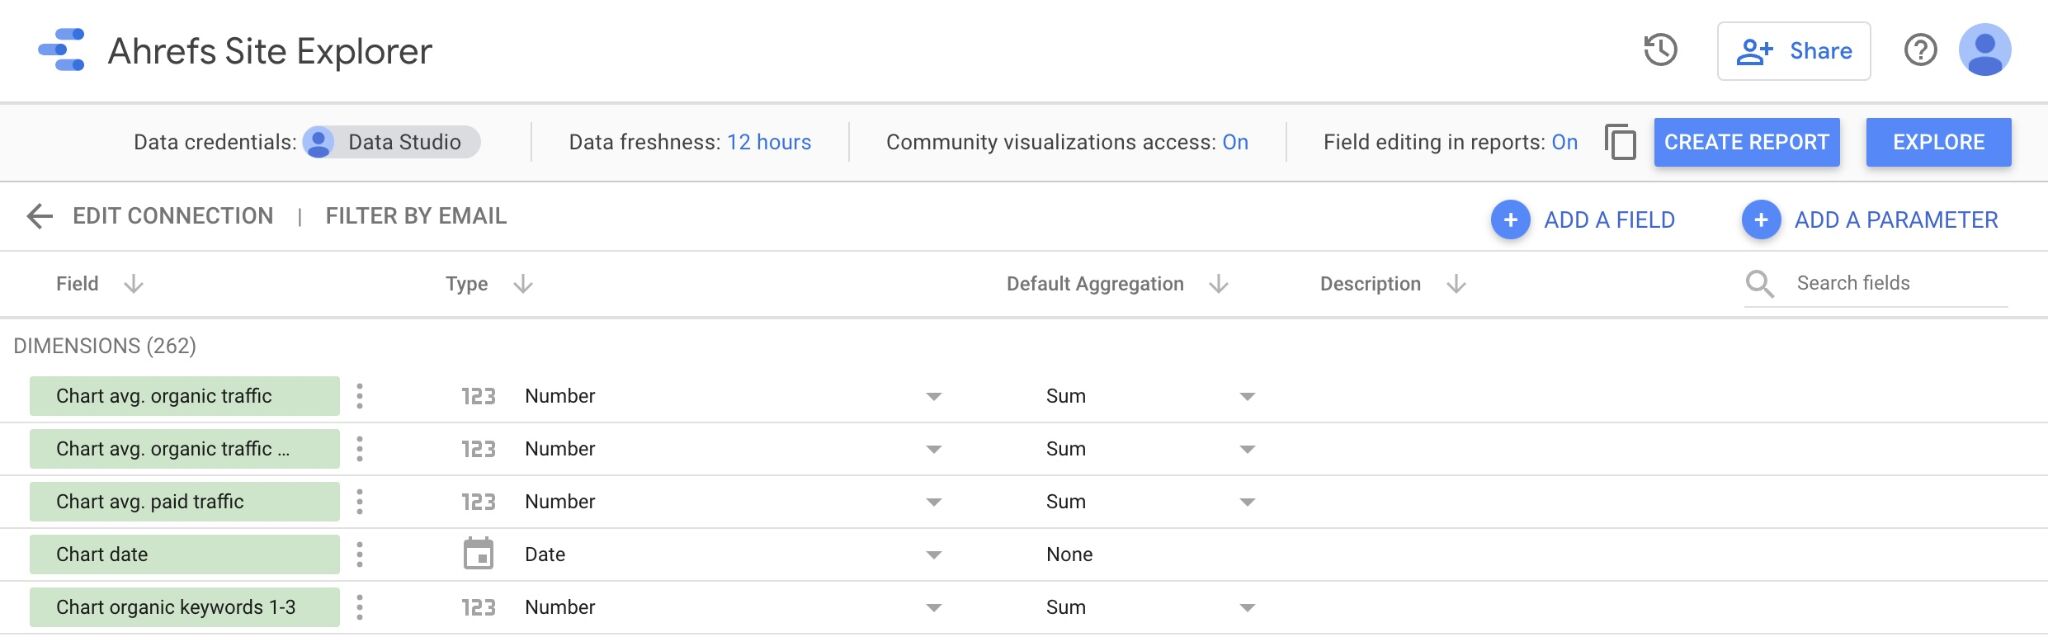
For example, to use Ahrefs with Looker, all you need to do is authorize the tool in Looker and choose data dimensions to be included in your report (like date, keyword positions, and organic traffic).
You can also mix data from different tools and use different input methods. For example, you can have Ahrefs data inserted automatically and your publishing output inserted manually through a Google sheet.
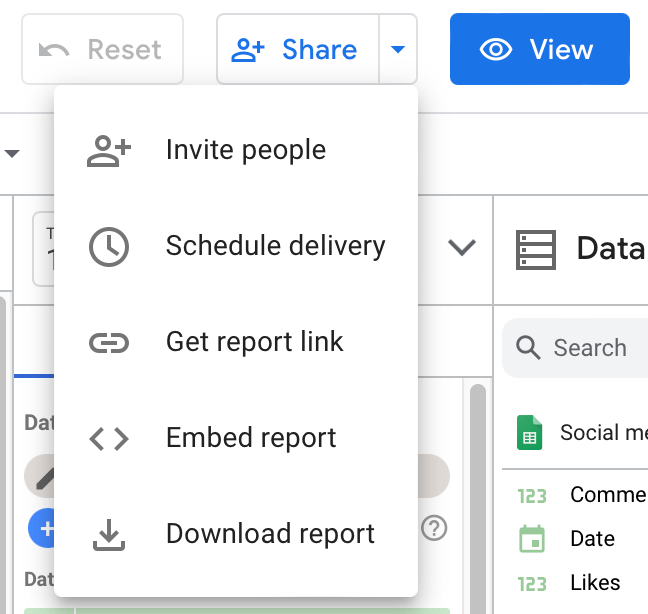
There is more than one way to share a report built in Looker. You can even schedule automated delivery with a custom message. The report doesn’t even have to be interactive — you can even report it in a document form.
You’ll know you’re really living in the XXI century when using this tool for reporting. It can:
- Perform data analysis tasks like correlation analysis, forecasting, creating data visualizations, or running calculations beyond the functionality of other tools.
- Clean and format data sets.
- Write ready-to-use Google Sheet formulas.
- Help you draw conclusions from raw data. You can even upload an image of a chart and ask for an interpretation.
- Help you with writing. For instance, executive summaries for your reports.
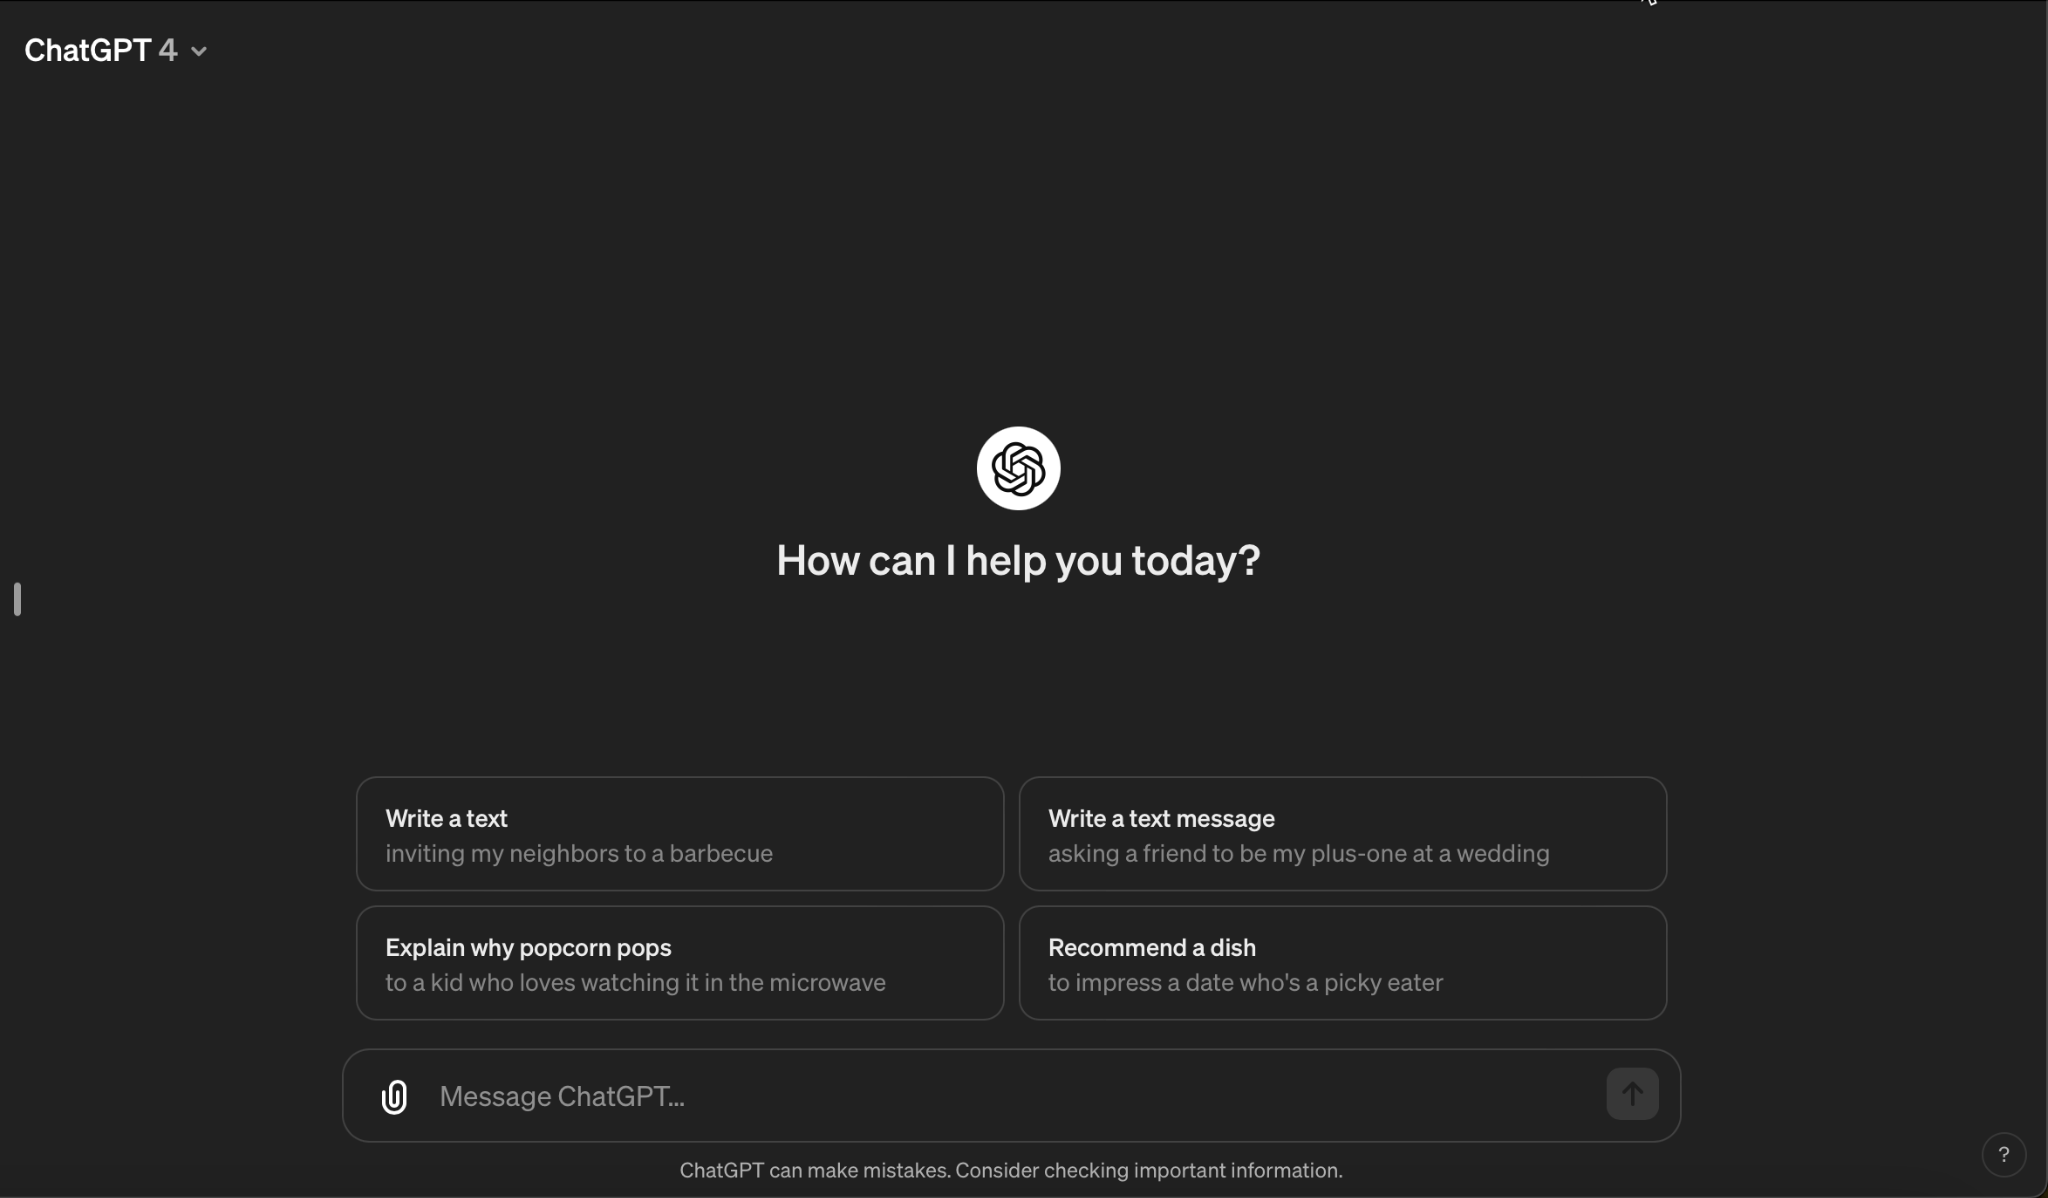
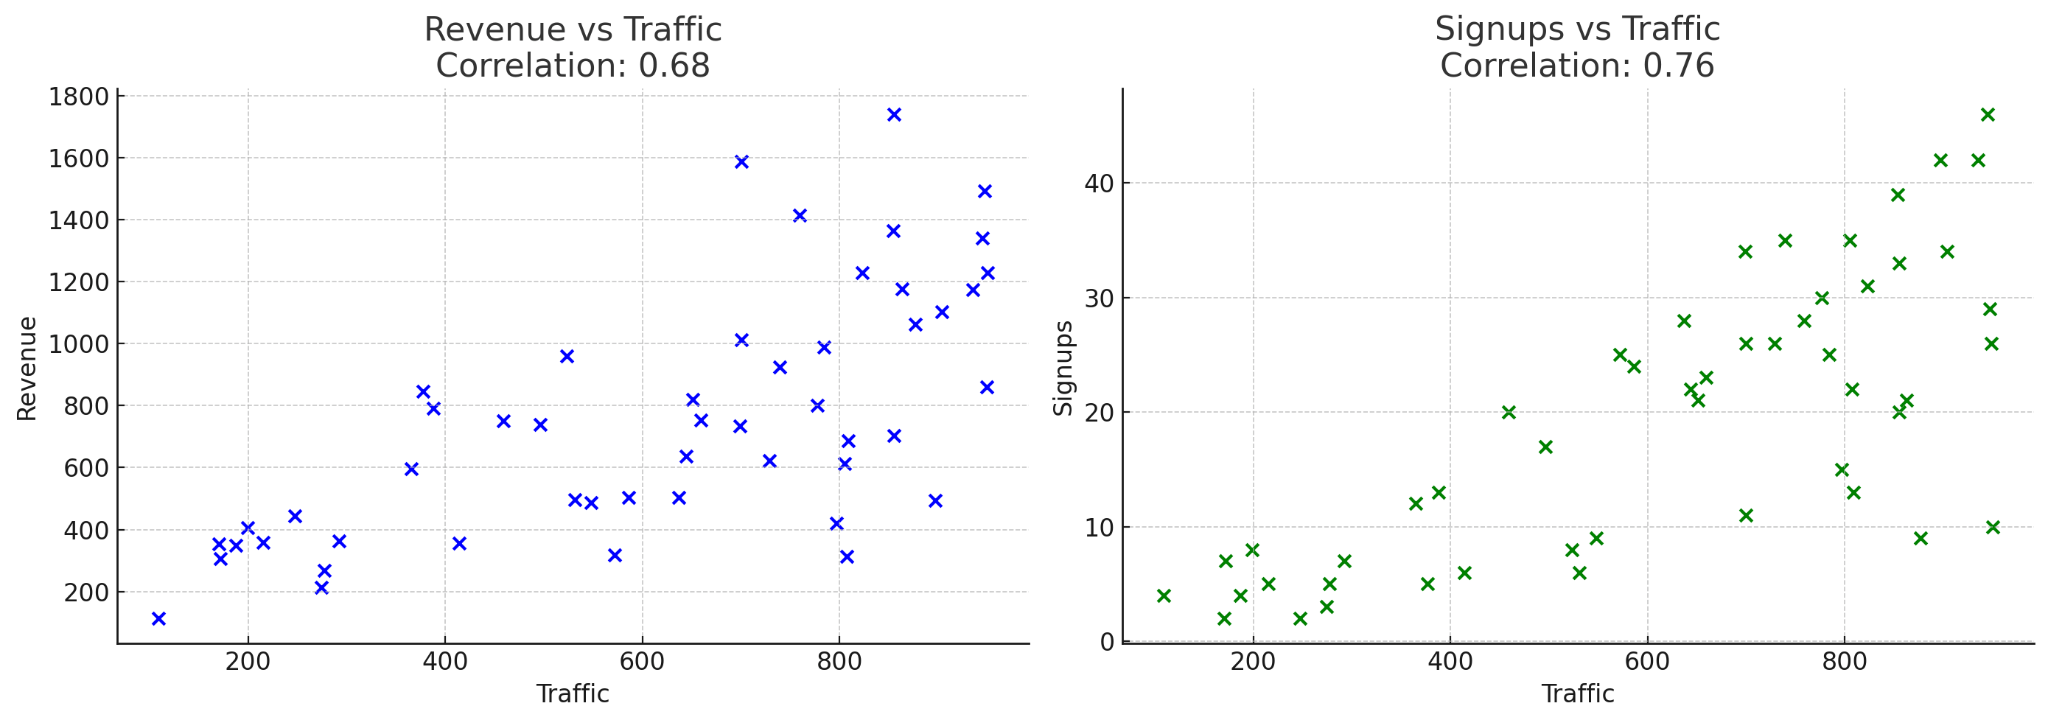
So basically, ChatGPT acts as your data-savvy copilot. For example, if you want to prove the correlation between revenue and organic traffic, you can ask Chat something like…
“Analyze this data, calculate and visualize the correlation between [data points]”…and it will generate charts like the ones below in no time.
Final thoughts
This selection of tools emphasizes a balance between affordability and functionality. No matter if you’re working in-house, agency, or as a freelancer, it gives you access to top-notch data analysis and reporting capabilities without needing to delve into complex coding or break the bank.
My advice would be to try to achieve the same balance in your choice of tools. It’s always a good idea to start by checking if any of your existing tools could do the job well enough.
On a final note, I didn’t list an email provider for tracking email engagement and lead generation metrics. The reason is, when it comes to reporting and even integrations with tools like Google Analytics, all popular tools are very similar, if not the same (e.g., Mailchimp, Mailerlite, Brevo, GetResponse). So, whatever you’re currently using for email marketing should be enough.